Google Drive is Driving up Traffic for the Urban Educator!

I am very excited to announce that one of my favorite bloggers, The Middle School Counselor, has posted my most recent blog post to her website! Check it out here!

I love the image Carol created for the post, thanks so much for sharing! Keep up the good work, I love your blog!

Google Drive

….and to all my new readers – thanks for all your support and I will continue to keep you updated with my life as an Urban Educator!

-Natalie

Google Form Example for School Counselors

I am blown away at the attention my last blog post has received about data received through google forms!!!! Thank you to everyone who has visited my blog and welcome to The Urban Educator!

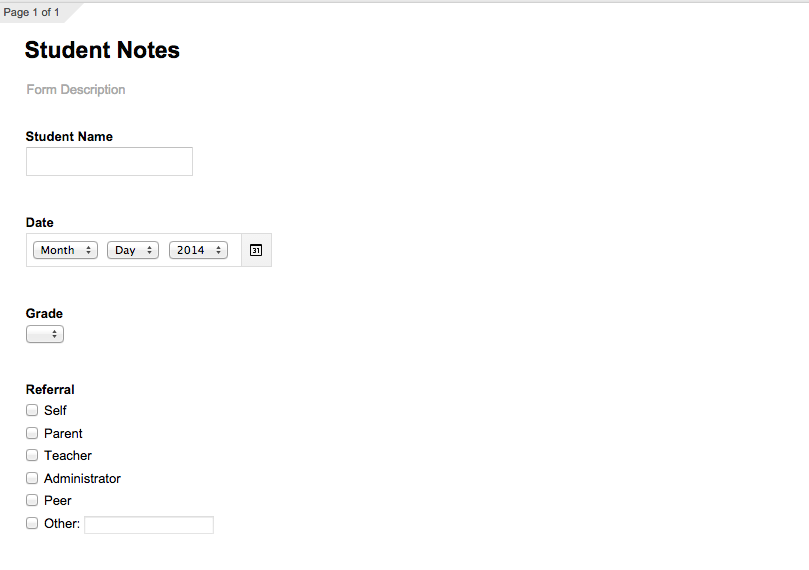
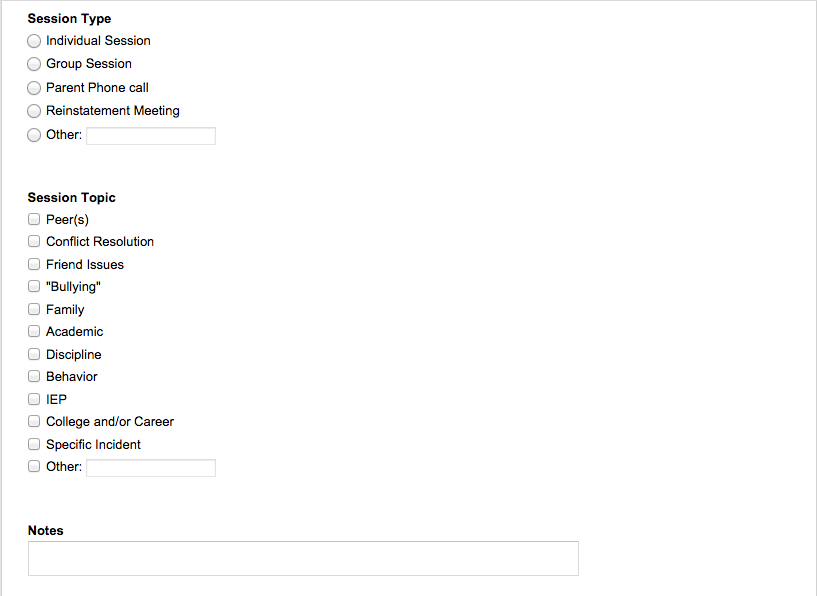
Many of you have asked to see the google form that I use…so the easiest way for me to share it with you was to make one especially for you (instead of giving you the link to the one I use everyday). Check out my google form for student notes here – this is the version I use to document my student notes (the live form) *this is just an example – you need to create your own to input student information*

This is what it looks like when I am creating the google form:

Screen Shot 2014-11-04 at 7.31.03 PM

Screen Shot 2014-11-04 at 7.31.06 PM

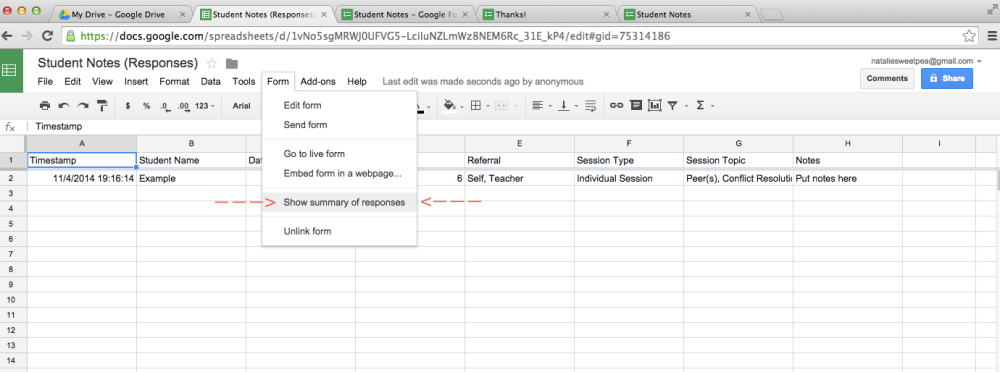
Once you create your google form through your google drive, there will automatically be a (Responses) table created that will show your responses in your google drive. This table will show you all of your responses and you can sort by grade, type or student (it will automatically sort by date). Many of you also asked how to see the graph after you have documented your student notes. This is the EASIEST part of the data collection process.  See photo below…all you have to do is click on FORM – SHOW SUMMARY OF RESPONSES and google creates that pretty little color coded graphs with all of your data 🙂

Summary of Responses

Any suggestions are always welcome! Collecting data is important to prove to everyone that your job is important and I personally find this way super easy. Best of luck and continue to check back often 🙂

-Natalie

Counseling Data

That scary 4 letter word, data. We are told we need it but sometimes have a hard time gathering it. Collecting it is time consuming…a burden for sure. But the end result can blow your mind.

The data doesn’t lie.

And it is certainly amazing to see – especially with pretty little color coded graphs outlining your month’s work! Welcome to my 2nd month counseling at my new school. September was slow because I was getting to know students and make daily schedules…I wasn’t quite impressed with what I had accomplished yet. This month, October, I got into a good groove, made a system for scheduling students and started lunch groups. Below you see my October Counseling Stats, made using Google Forms (my favorite data collection source – totally customizable for my needs and easily changed) which can take the table responses from my “Daily Notes Form” and transform it into the beautiful pictures below that explain what I do so much better than words!

Take the data and run.

After realizing that a lot of my students come in for peer related issues, I want to dig a little deeper. What are my most popular topics when students come to me to discuss peers? For November, I’m breaking it down into 3 additional sections:

  • Conflict resolution
  • “bullying”
  • Friend support

Hopefully I’ll gain additional insight into our peer issues to start new groups with those topics in mind.

October Student Data_Page_1

October Student Data_Page_2